Your OCR pipeline reports a Character Error Rate of 0.04. Clean. Except the page it ran on has three columns, the model merged two of them, and the “error rate” you’re looking at was computed over text in an order that exists nowhere on the page. The number isn’t slightly wrong — it’s measuring something that has no meaning. This is a short, interactive tour of why, and of a metric that gives you a number you can actually decompose.
The metric everyone already uses
Evaluate OCR today and one number comes out of the box: the Character Error Rate. It’s the edit distance — the count of insertions, deletions, and substitutions needed to turn the predicted text into the ground truth — normalised by the number of characters:
$$\text{CER} = \frac{\text{Substitutions} + \text{Deletions} + \text{Insertions}}{\text{Total characters}}$$
CER is simple, interpretable, and everywhere. It earned that place. But it carries a hidden assumption that is easy to forget: it compares one string to one string. It needs the whole page flattened into a single sequence, in the correct reading order, before it can say anything at all.
On a clean single-column page that’s fine. On a degraded 19th-century newspaper with multiple columns, headers, and ambiguous reading order, the assumption quietly fails — and CER fails with it.
When parsing breaks, CER breaks
Before OCR ever reads a character, a page-parsing (layout) model has to cut the page into regions. When it cuts them wrong, the text handed to CER is no longer a faithful sequence. Toggle the three classic parse failures and watch what the single string CER must consume turns into:
The trespass case is the killer. A box that straddles two regions reads across the boundary, so the words interleave: every character is still present, but the order is scrambled. CER, which counts edits against a sequence, explodes — and on genuinely disjoint regions there is no correct sequence to compare against, so CER is formally undefined. The bag-of-characters score barely flinches, because it never depended on order in the first place.
That’s the whole idea behind the Character Error Vector.
A different question: count characters, not sequences
The Character Error Vector (CEV) trades CER’s sequence-awareness for spatial-awareness. Represent a page’s text as a vector of character counts — a bag of characters — anchored to where the characters sit on the page. You lose the ability to catch a pure transposition (which CER is good at), but you gain something CER cannot offer: robustness to parse failures, and a representation you can treat as a distribution and pull apart.
Pulling it apart is the point. The CEV defines four vectors:
| Vector | What it is | Error it carries |
|---|---|---|
| $Q$ | ground-truth characters | none |
| $R$ | predicted parsing over GT characters | parsing only |
| $S^*$ | OCR run on the ground-truth regions | OCR only |
| $S$ | OCR run on the predicted regions | combined |
and reads three errors off the differences between them:
$$d_{\text{pars}} = d(R \parallel Q)$$
$$d_{\text{ocr}} = d(S^{*} \parallel Q)$$
$$d_{\text{int}} = d(S \parallel R)$$
with the end-to-end total $d_{\text{total}} = d(S \parallel Q)$. (Because these come from high-dimensional vectors, the parts are not additive — $d_{\text{total}} \neq d_{\text{pars}} + d_{\text{ocr}} + d_{\text{int}}$.)
The decomposition, live
Here’s the payoff made tangible. Drag the two sliders — one for how badly the
page is parsed, one for how badly the text is OCR’d — and watch the
error flow into the right component. d_pars lights up when parsing degrades;
d_ocr when transcription does; d_int captures the interaction; d_total is
what a single metric would have shown you. Switch between SpACER (a
CER-like magnitude) and JSD (sensitive to the shape of the character
distribution).
This is the thing CER can never do: tell you whether to fix the parser or the
OCR model. A high d_ocr with a low d_pars says retrain the transcriber; the
reverse says your layout model is the bottleneck and a better OCR head won’t
help.
SpACER: the CER-like instance
The CEV is a family, not a single formula. The most familiar member is SpACER — the Spatially Aware Character Error Rate — which blends the normalisation of total-variation distance with CER’s deletion sensitivity:
$$\text{SpACER} = \frac{D + \hat{E}}{2C}$$
$$\hat{E} = \lVert g - p \rVert_1 \qquad D = \max(0, |g| - |p|)$$
where $g$ and $p$ are the ground-truth and predicted character-count vectors and $C = |g|$. It behaves like CER — it can even exceed 1 — and across the experiments it lands at roughly half the measured CER at the bounding-box level: it’s a tight spatial lower bound. The other instance we ship, the Character Distribution Divergence, uses the Jensen–Shannon Distance — a proper, bounded metric that reacts strongly when OCR sprinkles rare junk symbols into the text.
On real, perfectly-parsed regions, SpACER tracks CER closely — confirming it measures the same thing when CER is even allowed to run:
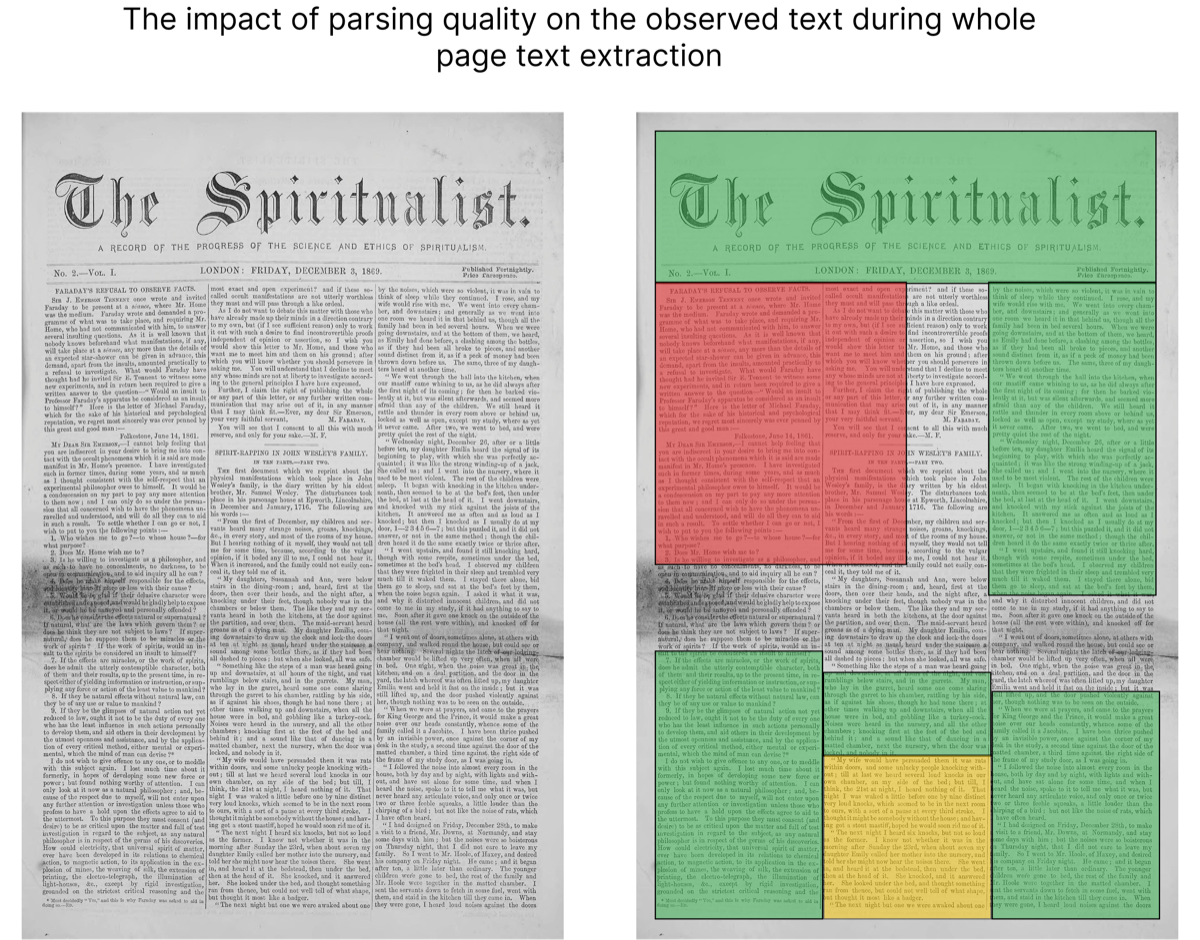
Real models, real verdicts
Now the case study: a 49-page archive of The Spiritualist, a degraded 19th-century newspaper with the kind of complex layout that breaks naive parsing. Here’s the parse-error vocabulary the CEV is built to survive — green parses cleanly, red boxes trespass across regions, yellow boxes overlap, and the gaps are missed entirely:
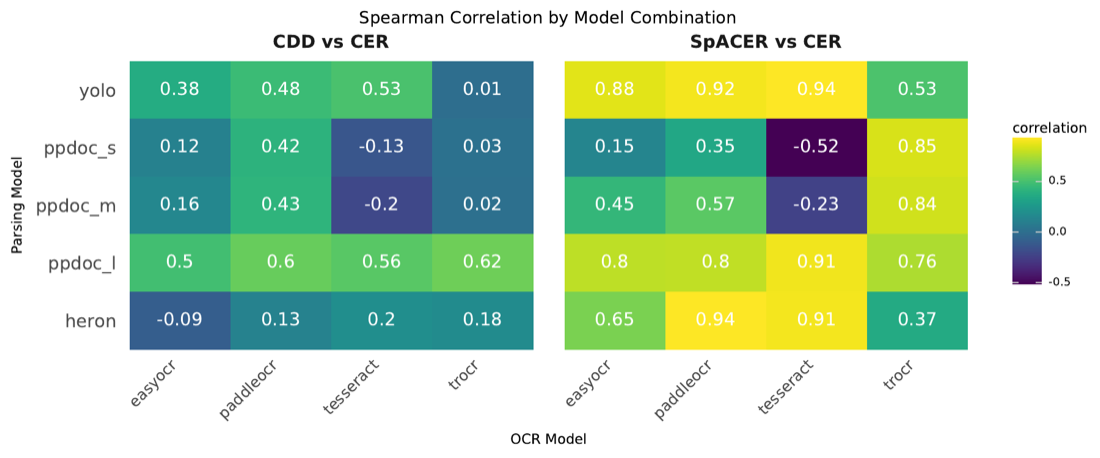
Run every parsing × OCR pipeline plus three state-of-the-art end-to-end VLMs,
score page-level d_total, and a clear — and slightly uncomfortable — picture
emerges:
Two findings worth sitting with. First, the end-to-end models lose. olmOCR,
dots.MOCR, and Granite-Docling have excellent raw OCR — olmOCR posts the lowest
d_ocr recorded — but their page parsing is weaker than a plain modular
pipeline, and the CEV decomposition is what lets you see that’s where they
fall down.
Second, the apparent overall winner is a trap. PPDoc-S earns the lowest
d_total of the lot (0.006) by parsing the page into a few enormous boxes that
swallow whole columns — junk that happens to contain about the right characters.
A bag-of-characters metric can’t see it. But the COTe Trespass component
can: 0.74, off the charts, instantly disqualifying the parse. Press the button
in the widget above. This is the ecosystem working — SpACER for magnitude, COTe
for geometry, together catching what neither sees alone.
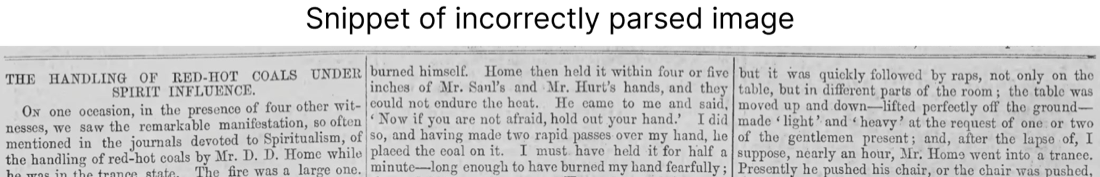
d_total is a lie: its prediction boxes swallow several columns at once. The character counts come out roughly right, so a bag-of-characters score looks great — but the text is unreadable, and COTe Trespass is what exposes it.That same partnership powers cheap triage: a simple cutoff of $\frac{d_\text{ocr}}{d_\text{total}} \geq 0.5$, combined with a COTe threshold, predicts whether parsing or OCR is your dominant error source with an F1 of 0.91 — even when you only have region-level boxes, no character positions.
Use it
SpACER and the CDD ship inside the same small Python library as the COTe score:
pip install cotescore
Point it at your predictions and ground truth and you get the decomposition back: how much of your page-level error is parsing, how much is OCR, and which one to fix first. If all you have is region-level annotation, the threshold heuristic still tells you where the bottleneck is — no character positions required.
The full method, the validation, and the Spiritualist case study are in the paper: arXiv:2604.06160 · code · library.